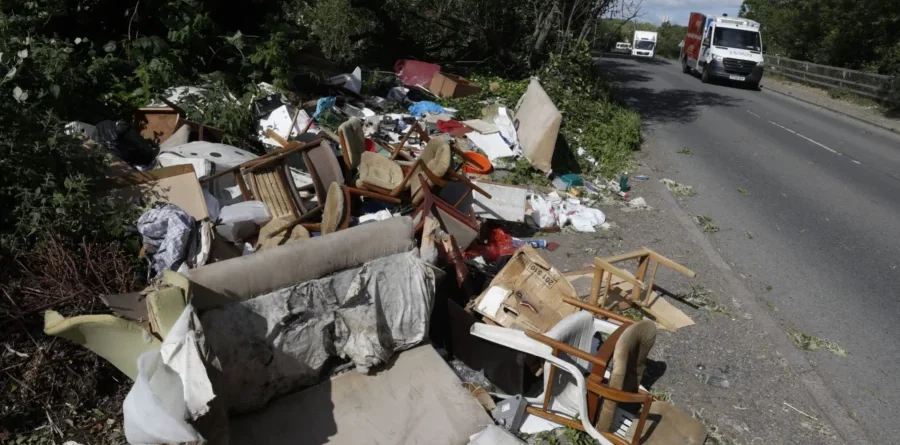
The East of England towns and cities where fly-tipping is worst
23/08/2023 - Reliable Skip Hire

East of England fly-tipping capitals, revealed
- Peterborough has East of England’s highest rate of fly-tipping, while Stevenage is second and Norwich is third
- Overall the East of England have the seventh highest fly-tipping rate in England
A new study reveals that Peterborough ranks as the worst place in the East of England for fly-tipping.
The study, conducted by national skip hire company Reliable Skip Hire, analysed Defra’s latest stats to discover where fly-tipping rates, i.e., the illegal practice of leaving liquid or solid waste on land or in water, are highest across the country. The data was compared to the population to even out the results.
Peterborough tops the list in the South East with 41.51 fly-tipping incidents recorded per 1,000 people in 2021/22. The rate is more than double the national average for England, which stands at 19.07 incidents per 1,000 people.
The East’s second fly-tipping hotspot is Stevenage after 36.08 incidents were recorded per 1,000 people in the city.
Norwich places third due to 33.57 instances of fly-tipping for every 1,000 of its population, while Welwyn Hatfield is just behind it in fourth with 31.14 per 1,000 people.
Completing the top five is Luton, where 27.83 fly-tipping incidents per 1,000 people were noted.
At the other end of the scale, there were just 2.71 fly-tipping incidents per 1,000 people in West Suffolk, the East of England’s place with the lowest rate. The next lowest numbers were Uttlesford, on 2.74, and South Cambridgeshire on 3.44.
Paul Bennett, Operations Director at Reliable Skip, commented on the findings: “Fly-tipping in England is a growing concern. The data shows that there were around 714,000 incidents of fly-tipping recorded in England in 2012/13, a figure which has gone up to more than one million in 2021/22 – more than a 50% increase over ten years. More than £7 million in fines have been handed out during that period, and it’s important for people to note that there are legal and responsible ways to dispose of waste and unwanted goods which won’t damage public spaces or break the law.”
| East of England local authorities ranked by rates of fly-tipping | |||
| Rank | Local Authority | Estimated Population | Incidents per 1,000 people |
| 1 | Peterborough | 216,349 | 41.51 |
| 2 | Stevenage | 89,320 | 36.08 |
| 3 | Norwich | 143,118 | 33.57 |
| 4 | Welwyn Hatfield | 119,538 | 31.14 |
| 5 | Luton | 224,826 | 27.83 |
| 6 | Harlow | 93,374 | 23.33 |
| 7 | Basildon | 187,659 | 19.62 |
| 8 | Great Yarmouth | 100,146 | 18.66 |
| 9 | Epping Forest | 134,909 | 16.82 |
| 10 | Cambridge | 144,714 | 15.78 |
The City of London takes first place nationally with 289.74 incidents per 1,000 people in 2021/22. The rate in the area is significantly higher than any other local authority, at almost twice the rate of incidents registered for the second area on the list, Camden.
Camden registered 154.56 incidents per 1,000 people, while Hounslow was in third place, with 116.73 incidents per 1,000 people.
Further down on the list, Hammersmith and Fulham come in fourth place with 109.29 fly-tipping incidents in 2021/22 per 1,000 people.
The top five closes with Brent with 105.75 incidents.
The list continues with Lewisham, Westminster, and Merton, respectively, with 98.45, 91.42 and 82.27 incidents per 1,000 people.
The top ten ends with Haringey in ninth place with 75.93 incidents and Newham in tenth place with 73.81.
Story credit – https://www.reliableskip.com/
Image credit – Reliable Skip
Data sourced from Defra
All articles on this news site are submitted by registered contributors of SuffolkWire. Find out how to subscribe and submit your stories here »

